Note
Go to the end to download the full example code.
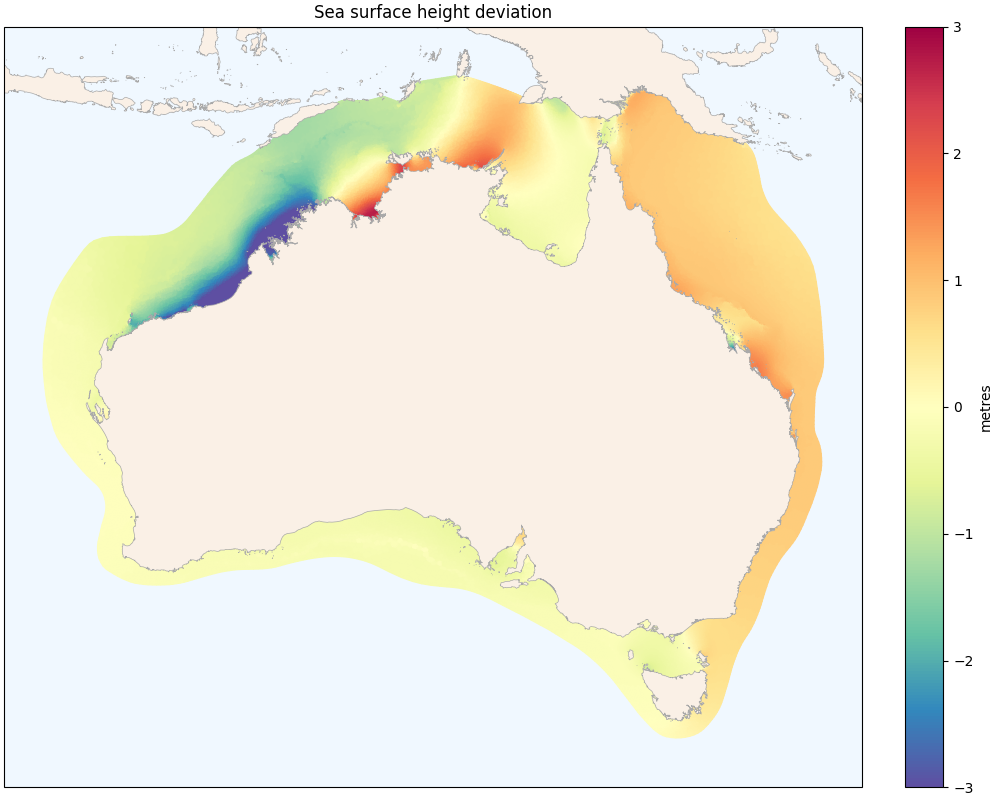
Plot with specified data limits#
Convention.make_artist() method will create an appropriate
Artist to plot a variable.
The artist can be customised by passing kwargs to make_artist().
The make_artist() documentation for each convention
will describe what artists are created for what kinds of variables.
Typically a scalar variable defined on a polygon grid
will be drawn using a PolyCollection.
This class accepts options such as clim and cmap
which can be used to customise the appearance of the plot.
import cartopy.crs
import emsarray
import emsarray.plot
from emsarray.plot.shortcuts import monkeypatch_gshhs_downloader
from cartopy.feature import GSHHSFeature
from matplotlib import pyplot

# Open the dataset
ds = emsarray.tutorial.open_dataset('austen')

# Make a figure
figure = pyplot.figure(figsize=(10, 8), layout='constrained')
axes = figure.add_subplot(projection=cartopy.crs.PlateCarree())
axes.set_aspect('equal', adjustable='datalim')

# Make an artist to plot eta
eta_artist = ds.ems.make_artist(
    axes, ds['eta'].isel(record=0),
    add_colorbar=False,
    clim=(-3, 3), edgecolor='face', cmap='Spectral_r',
)
figure.colorbar(eta_artist, ax=axes, location='right', label="metres")

# Draw some coastlines
# Temporary workaround for https://github.com/SciTools/cartopy/pull/2659/changes
monkeypatch_gshhs_downloader()
coast = GSHHSFeature(scale='intermediate')
axes.add_feature(coast, facecolor='linen', edgecolor='darkgrey', linewidth=0.5)

# Finish setting up the plot
axes.autoscale()
axes.set_title("Sea surface height deviation")
axes.set_facecolor('aliceblue')

pyplot.show()
Total running time of the script: (0 minutes 6.766 seconds)