Note
Go to the end to download the full example code.
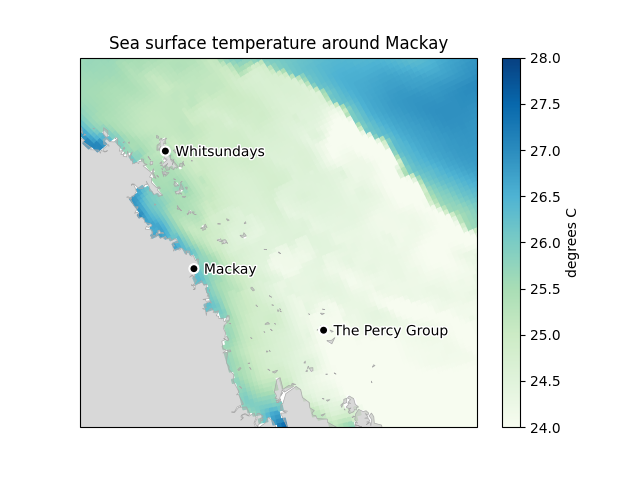
Plot a small area with landmarks#
You can use Axes.set_extent() to display a region of interest on a plot.
Combined with add_landmarks() to highlight regional landmarks.
import emsarray.plot
import shapely
from matplotlib import pyplot

dataset = emsarray.tutorial.open_dataset('gbr4')

# Set up the figure
figure = pyplot.figure()
axes = figure.add_subplot(projection=dataset.ems.data_crs)
axes.set_title("Sea surface temperature around Mackay")
axes.set_aspect('equal', adjustable='datalim')
emsarray.plot.add_coast(axes, zorder=1)

# Focus on the area of interest
axes.set_extent((148.245710, 151.544167, -19.870197, -21.986412))

# Plot the temperature
temperature = dataset.ems.make_artist(
    axes, dataset['temp'].isel(time=0, k=-1),
    cmap='GnBu', clim=(24, 28), edgecolor='face', zorder=0)

# Name key locations
emsarray.plot.add_landmarks(axes, [
    ('The Percy Group', shapely.Point(150.270579, -21.658269)),
    ('Whitsundays', shapely.Point(148.955319, -20.169076)),
    ('Mackay', shapely.Point(149.192671, -21.146719)),
])

pyplot.show()
Total running time of the script: (1 minutes 10.090 seconds)