Note
Go to the end to download the full example code.
Vector plotting methods#
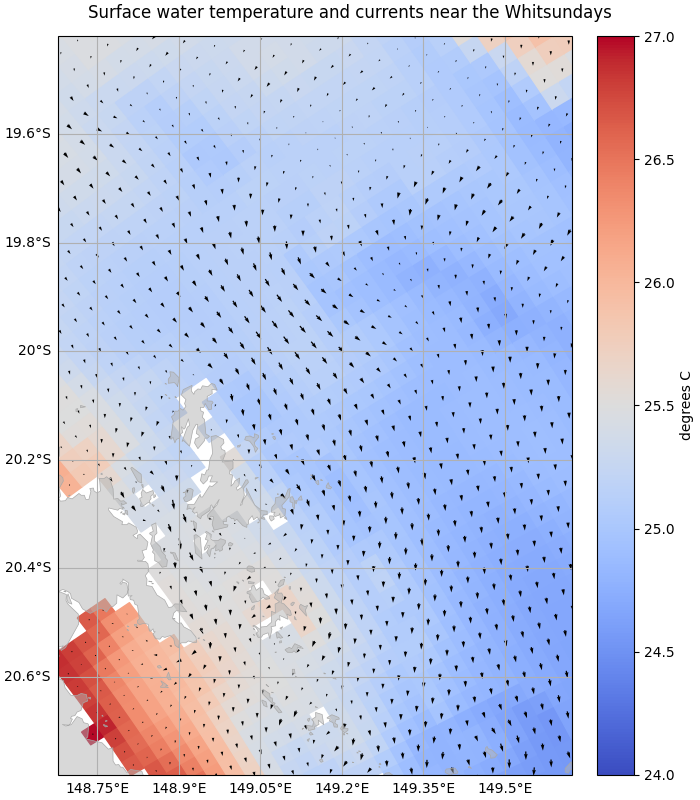
To plot vector quantities such as currents we can use a quiver plot in matplotlib. In the GBR4 tutorial dataset the u and v variables contain the x and y components of the vector for each cell in the dataset.
import matplotlib.pyplot as plt
import numpy
import pandas
import xarray
from shapely import box

import emsarray
from emsarray import plot
from emsarray.operations import point_extraction

dataset = emsarray.tutorial.open_dataset('gbr4')

surface_currents = dataset.ems.select_variables(["temp", "u", "v"]).isel(time=0, k=-1)
surface_currents.load()
Plotting every cell is straight forward for small areas:
figure = plt.figure(figsize=(7, 8), layout="constrained")
axes = figure.add_subplot(projection=dataset.ems.data_crs)
figure.suptitle("Surface water temperature and currents near the Whitsundays")

temp = surface_currents["temp"]
temp_artist = dataset.ems.make_artist(
    axes, temp,
    cmap="coolwarm", clim=(24, 27))

current_artist = dataset.ems.make_artist(
    axes, (surface_currents["u"], surface_currents["v"]),
    scale=20, scale_units="width")

plot.add_coast(axes)
plot.add_gridlines(axes)

# Just show a small area over the Whitsundays
view_box = box(148.7, -20.4, 149.6, -19.8)
axes.set_aspect("equal", adjustable="datalim")
axes.set_extent(plot.bounds_to_extent(view_box.bounds))
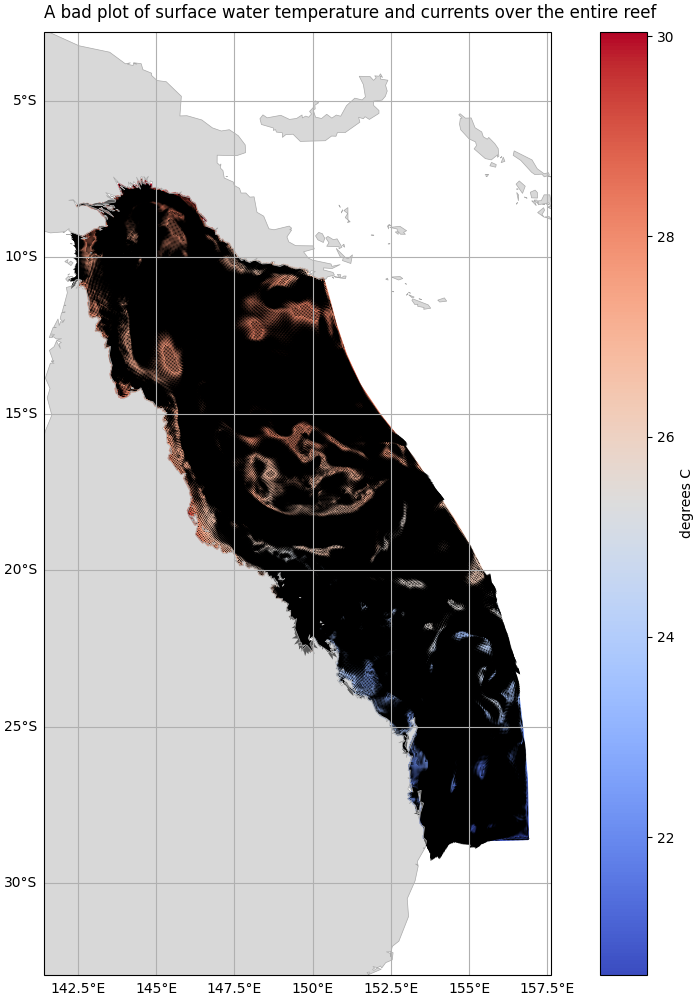
Plotting the entire dataset this way leads to the current vectors becoming a confusing mess however:
figure = plt.figure(figsize=(7, 10), layout="constrained")
axes = figure.add_subplot(projection=dataset.ems.data_crs)
figure.suptitle("A bad plot of surface water temperature and currents over the entire reef")

temp = surface_currents["temp"]
temp_artist = dataset.ems.make_artist(axes, temp, cmap="coolwarm")

current_artist = dataset.ems.make_artist(
    axes, (surface_currents["u"], surface_currents["v"]),
    scale=20, scale_units="width")

plot.add_coast(axes)
plot.add_gridlines(axes)

# Show the entire model domain
axes.set_aspect("equal", adjustable="datalim")
axes.autoscale()
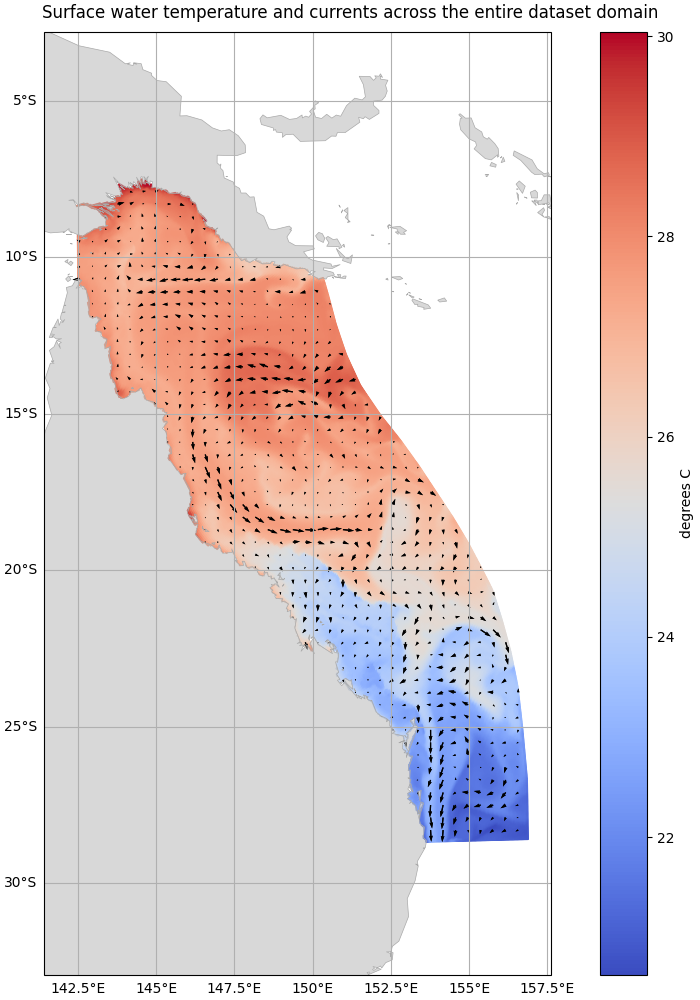
Sampling gridded datasets#
For datasets on a two dimensional grid like this we can sample the current data at regular intervals to display only a subset of the vectors. The sampled points will follow the geometry of the dataset. For curvilinear datasets such as GBR4 the vectors will follow the curves of the dataset shape:
# Make an empty array of the same shape as the data, then select every 10th cell in there.
face_grid = dataset.ems.get_grid(surface_currents["u"])
samples = xarray.DataArray(numpy.full(face_grid.size, False))
samples = face_grid.wind(samples)
samples[::10, ::10] = True
samples = dataset.ems.ravel(samples)

# Select the (x, y) coordinates and the (u, v) components of the sampled cells
x, y = face_grid.centroid_coordinates[samples].T
u = dataset.ems.ravel(surface_currents["u"]).values[samples]
v = dataset.ems.ravel(surface_currents["v"]).values[samples]

# Plot the points
figure = plt.figure(figsize=(7, 10), layout="constrained")
axes = figure.add_subplot(projection=dataset.ems.data_crs)
figure.suptitle("Surface water temperature and currents across the entire dataset domain")

temp = surface_currents["temp"]
temp_artist = dataset.ems.make_artist(axes, temp, cmap="coolwarm")

quiver = plt.quiver(
    x, y, u, v,
    scale=40, scale_units="width")
axes.add_collection(quiver)

plot.add_coast(axes)
plot.add_gridlines(axes)

# Show the entire model domain
axes.set_aspect("equal", adjustable="datalim")
axes.autoscale()

Sampling the dataset domain#
Another approach is to plot vectors at regular points across the dataset domain
by sampling at regular intervals.
The vector locations are not tied to the grid geometry.
This approach will work with unstructured grids unlike the previous method.
point_extraction.extract_dataframe() can be used for this:
# Generate a mesh of points across the dataset domain
domain = box(*dataset.ems.bounds)
x = numpy.arange(domain.bounds[0], domain.bounds[2], 0.4)
y = numpy.arange(domain.bounds[1], domain.bounds[3], 0.4)
xx, yy = numpy.meshgrid(x, y)
points = pandas.DataFrame({
    'x': xx.flatten(),
    'y': yy.flatten(),
})

# Extract the surface current components at these locations
components = point_extraction.extract_dataframe(
    surface_currents, points, ('x', 'y'), missing_points='drop')

# Plot the points
figure = plt.figure(figsize=(7, 10), layout="constrained")
axes = figure.add_subplot(projection=dataset.ems.data_crs)
figure.suptitle("Surface water temperature and currents across the entire dataset domain")

temp = surface_currents["temp"]
temp_artist = dataset.ems.make_artist(axes, temp, cmap="coolwarm")

quiver = plt.quiver(
    components['x'], components['y'], components['u'], components['v'],
    scale=30, scale_units="width")
axes.add_collection(quiver)

plot.add_coast(axes)
plot.add_gridlines(axes)

axes.set_aspect("equal", adjustable="datalim")
axes.autoscale()
Total running time of the script: (0 minutes 14.574 seconds)