Overview#
emsarray is an extension of xarray
that understands many geometry conventions used to represent data.
emsarray presents a unified interface to extract data at a point,
clip a dataset to a region,
or plot data to a figure.
It does this through the Convention interface.
Most emsarray functionality is available through the dataset.ems attribute on any xarray dataset. More utilities are provided in the emsarray.operations modules.
Opening datasets#
The simplest way to open a dataset is using emsarray.open_dataset():
import emsarray
dataset = emsarray.open_dataset(...)
A number of example datasets can be opened
using emsarray.tutorial.open_dataset():
import emsarray
dataset = emsarray.tutorial.open_dataset('gbr4')
As long as emsarray has been imported,
every xarray dataset will have the dataset.ems attribute.
This includes datasets opened using xarray.open_mfdataset().
See Registering the accessor for further information.
Extracting data from a point#
To get data at a single point
use dataset.ems.select_point:
from shapely.geometry import Point

capricorn_group = Point(151.869, -23.386)
point_data = dataset.ems.select_point(capricorn_group)
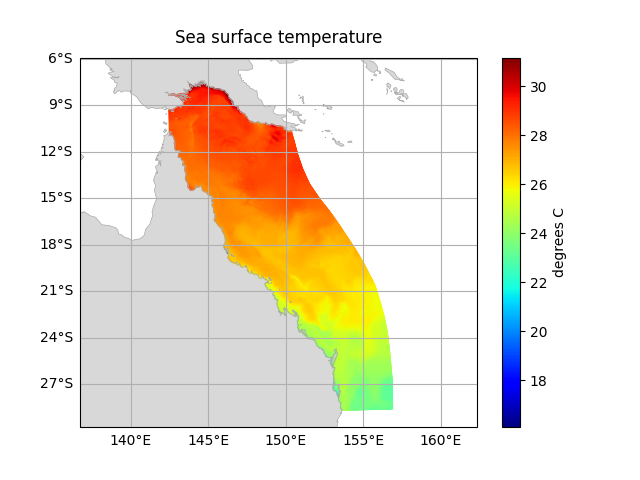
Plotting data#
Plots of a variable can be easily generated
using dataset.ems.plot.
Pass the variable to plot to this method.
If the variable has time, depth, or other ‘extra’ dimensions
use DataArray.sel() or DataArray.isel() to select just one index:
# temp has both time and depth (k) dimensions.
# Select just one index from these
surface_temp = dataset['temp'].isel(time=0, k=-1)
dataset.ems.plot(surface_temp)
Exporting geometry#
emsarray.operations.geometry
can export dataset geometry to a number of formats.
This is useful if you want to examine the geometry QGIS or ArcGIS,
or use the geometry in another process.
from emsarray.operations import geometry

geometry.write_shapefile(dataset, 'geometry.shp')