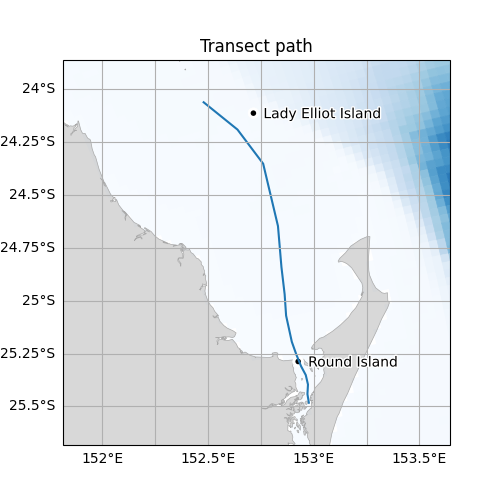
K’gari transect plot#
The following is a transect path
starting in the Great Sandy Strait near K’gari,
heading roughly North out to deeper waters:
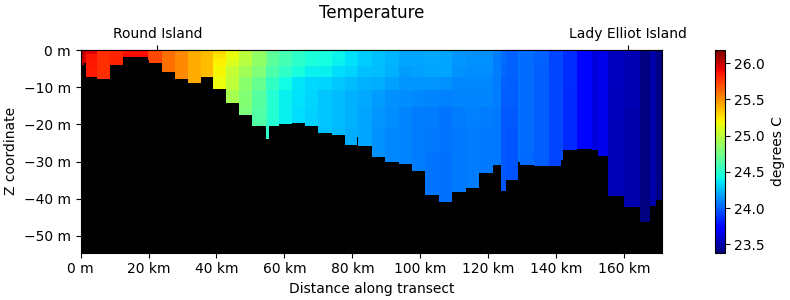
The temperature along this transect can be plotted:
Code#
Download kgari-transect.py example.
import emsarray
import shapely
from emsarray import plot, transect
from matplotlib import pyplot

dataset_url = 'https://dapds00.nci.org.au/thredds/dodsC/fx3/model_data/gbr4_bgc_GBR4_H2p0_B2p0_Chyd_Dcrt.ncml'
dataset = emsarray.open_dataset(dataset_url).isel(time=-1)
dataset = dataset.ems.select_variables(['botz', 'temp'])

line = shapely.LineString([
    [152.9768944, -25.4827962],
    [152.9701996, -25.4420345],
    [152.9727745, -25.3967620],
    [152.9623032, -25.3517828],
    [152.9401588, -25.3103560],
    [152.9173279, -25.2538563],
    [152.8962135, -25.1942238],
    [152.8692627, -25.0706729],
    [152.8623962, -24.9698750],
    [152.8472900, -24.8415806],
    [152.8308105, -24.6470172],
    [152.7607727, -24.3521012],
    [152.6392365, -24.1906056],
    [152.4792480, -24.0615124],
])
landmarks = [
    ('Round Island', shapely.Point(152.9262543, -25.2878719)),
    ('Lady Elliot Island', shapely.Point(152.7145958, -24.1129146)),
]

# Plot the transect
figure = transect.plot(
    dataset, line, dataset['temp'],
    figsize=(7.9, 3),
    bathymetry=dataset['botz'],
    landmarks=landmarks)
figure.savefig('kgari-transect.png')

# Plot the path of the transect
figure = pyplot.figure(figsize=(5, 5), dpi=100)
axes = figure.add_subplot(projection=dataset.ems.data_crs)
axes.set_aspect(aspect='equal', adjustable='datalim')
axes.set_title('Transect path')
axes.add_collection(dataset.ems.make_poly_collection(
    dataset['botz'], cmap='Blues_r', edgecolor='face',
    linewidth=0.5, zorder=0))
plot.add_coast(axes, zorder=1)
plot.add_gridlines(axes)
plot.add_landmarks(axes, landmarks)
axes = figure.axes[0]
axes.set_extent(plot.bounds_to_extent(line.envelope.buffer(0.2).bounds))
axes.plot(*line.coords.xy, zorder=2)
figure.savefig('kgari-path.png')

pyplot.show(block=True)