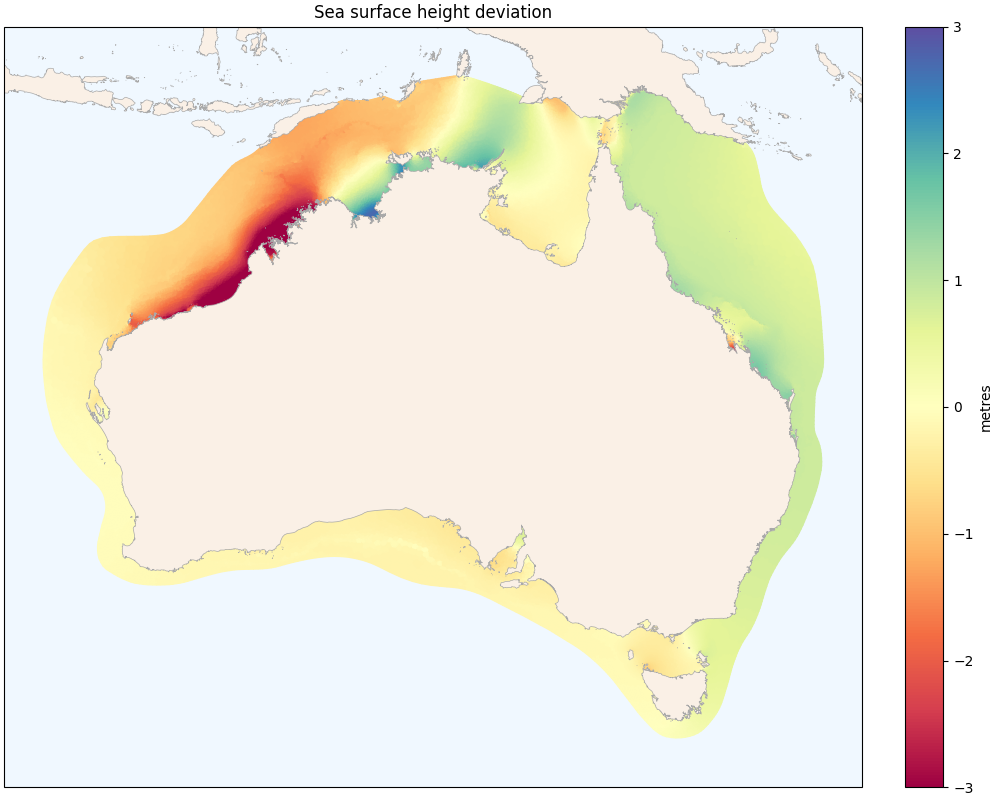
Plot with specified data limits#
The Convention.make_poly_collection() method passes all keyword arguments
on to PolyCollection.
This can be used to customise the appearance of the collection
and to set parameters such as clim:
Code#
Download plot-with-clim.py example.
import cartopy.crs
import emsarray
import emsarray.plot
from cartopy.feature import GSHHSFeature
from matplotlib import pyplot

ds = emsarray.tutorial.open_dataset('austen')

figure = pyplot.figure(figsize=(10, 8), layout='constrained')
axes = figure.add_subplot(projection=cartopy.crs.PlateCarree())
axes.set_aspect('equal', adjustable='datalim')

polys = ds.ems.make_poly_collection(
    ds['eta'].isel(record=0),
    clim=(-3, 3), edgecolor='face',
    cmap='Spectral',
)
axes.add_collection(polys)
figure.colorbar(polys, ax=axes, location='right', label="metres")

coast = GSHHSFeature(scale='intermediate')
axes.add_feature(coast, facecolor='linen', edgecolor='darkgrey', linewidth=0.5)

axes.autoscale()
axes.set_title("Sea surface height deviation")
axes.set_facecolor('aliceblue')

figure.savefig('plot-with-clim.png')

pyplot.show(block=True)